As DNAinfo’s visual journalist, I’ve worked on scores of interactive projects. Some are maps, some are quizzes. Some needed data, some didn’t. Here are more than a few that I’m proud of.
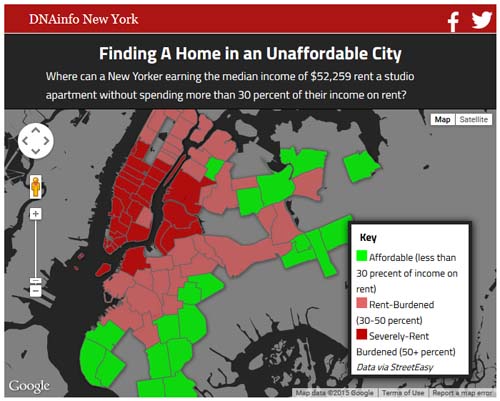 Map: Where can the average New Yorker afford a studio apartment? This map compared median studio apartment asking price data with city’s median income to show where an “average” residents would be able to rent a studio without breaking the bank. Built with the Google Maps JavaScript API and Google Fusion Tables.
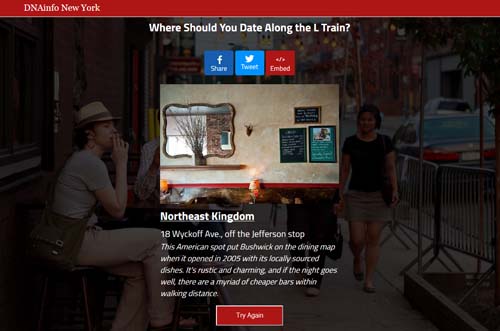 L-Train Date Spot Quiz: This is a custom quiz where the taker learns where they can go for a date along the L train. To me it’s the spiritual successor to the Midtown Lunch Quiz, as it’s the same underlying idea (a flow-chart in quiz form), but it’s built with a higher level of sophistication. Built with HTML, CSS, JavaScript, jQuery and the Google Spreadsheets API.
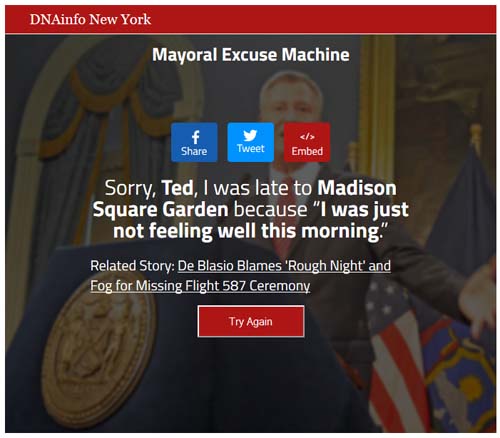 Mayoral Excuse Machine: One of my all-time favorite projects, this interactive lets you generate your own custom excuse based on one of Mayor Bill de Blasio’s real excuses. We actually update this every time the mayor shows up late to an event. Built with HTML, CSS, JavaScript, jQuery and the Google Spreadsheets API.
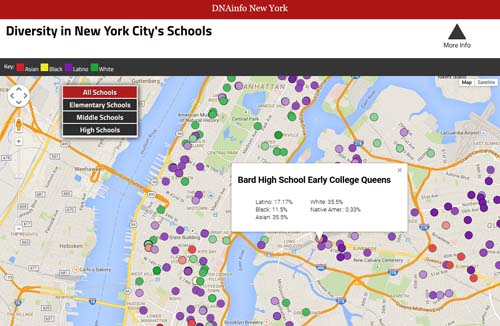 Public School Diversity: Perhaps the map I’m most proud of. This map shows the racial breakdown of every single NYC elementary, middle and high school and color-codes each school based on the largest racial group. It very clearly shows the level of segregation still present in city’s schools. UPDATE: This map won a 2015 Ippie award for best multimedia package.
 Neighborhood Trivia: This went with a story about trivia night across the five boroughs. I’ve got a soft spot for this project because I built this completely by hand, no jQuery plugins needed.
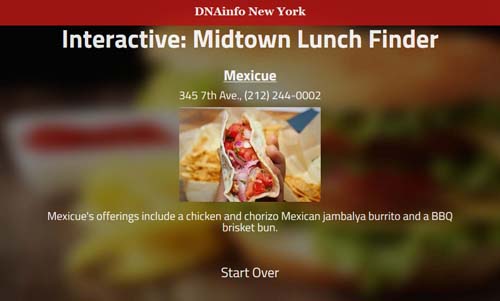 The Midtown Lunch Finder: I built this because finding lunch in midtown sucks and I wanted to make it suck less. I put a lot of design care into it, but the coding wasn’t very sophisticated. Every single answer was hard-coded in. This was a project where I my end goal was beyond my current skill set, but I’d be damned if I let that stop me.
 De Blasio’s year in words: This story required me to go through all of the mayor’s public appearances from 2014 and count up all of his words. I was originally going to do just a word cloud, but then I broke key words down by month and saw it really gave a good look at how big events took the mayor off-message later in the year. The chart’s made with Datawrapper.
 Where in the World is Mitchell Silver: This one we had some fun with. The story is about how the parks commissioner was so busy traveling the world during his first year that community groups had a hard time getting a meeting with him. We got his travel records, so we figured why not just show where here’s been? The maps’s made with Odyssey.js, the plane is a custom PhotoShop job.
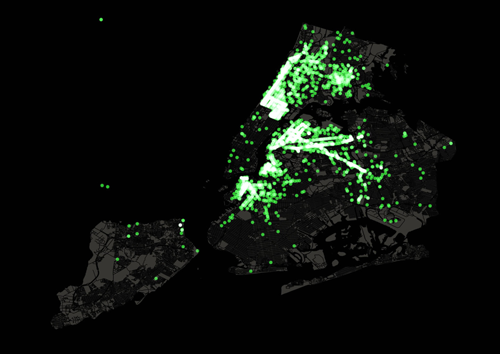
Where the Green Cabs Are: This one started with a hunch, green cabs were stopping in richer outer-borough nabes and ignoring poorer ones. I FOIL’ed for the data (as did Chris Whong) and found that the hunch was mostly right. These maps were built with the Google Maps JavaScript API and QGIS.
